insert wide/iterative
|
|
Additional Statistics:
| Lower bound | Estimate | Upper bound | |
|---|---|---|---|
| R² | 0.0033663 | 0.0034813 | 0.0033392 |
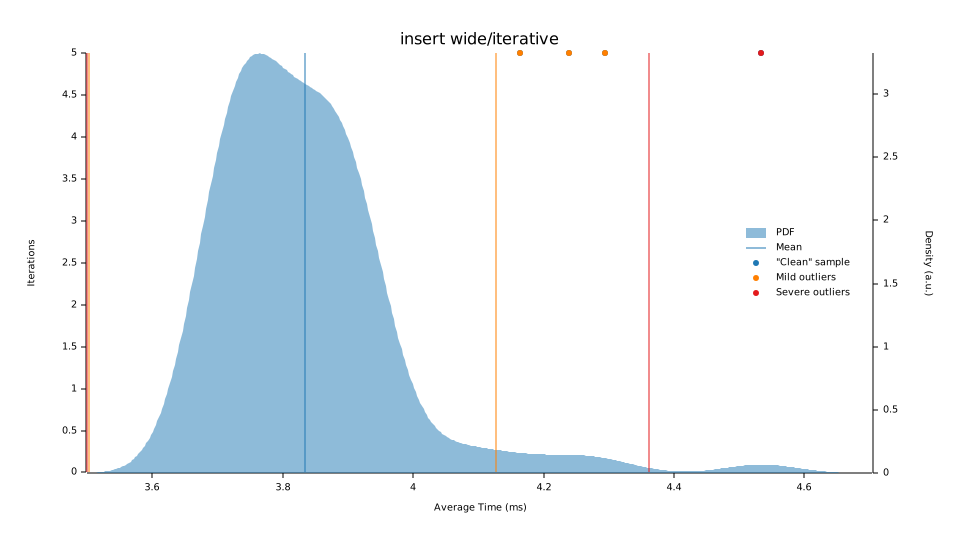
| Mean | 3.8093 ms | 3.8341 ms | 3.8618 ms |
| Std. Dev. | 94.413 µs | 134.58 µs | 173.98 µs |
| Median | 3.7774 ms | 3.8137 ms | 3.8495 ms |
| MAD | 89.423 µs | 117.43 µs | 130.95 µs |


Understanding this report:
The plot on the left displays the average time per iteration for this benchmark. The shaded region shows the estimated probability of an iteration taking a certain amount of time, while the line shows the mean. Click on the plot for a larger view showing the outliers.
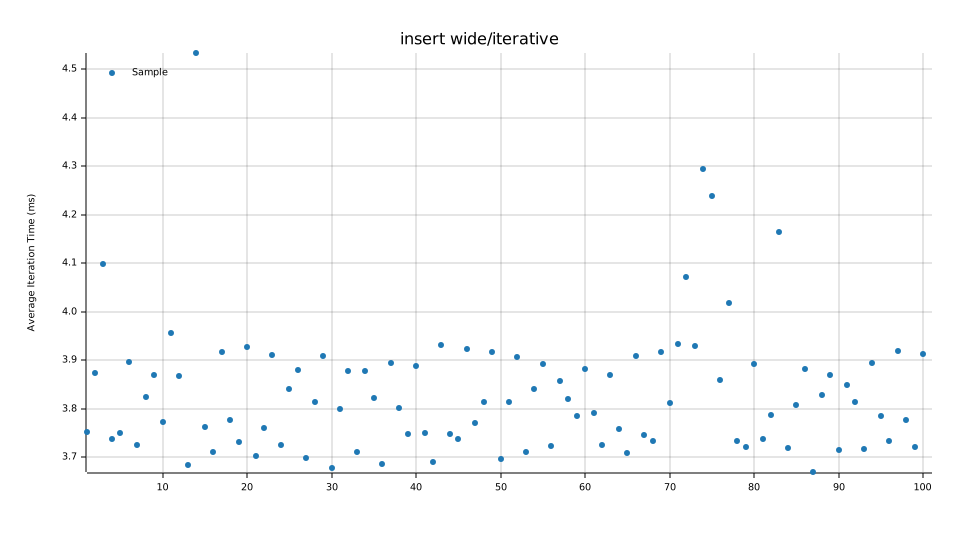
The plot on the right shows the average time per iteration for the samples. Each point represents one sample.
See the documentation for more details on the additional statistics.